Dust on the Glass: Recovering an 11.7% Soiling Loss at a Solar Plant
How Kavaken detected soiling on one inverter unit, tracked the growing loss, and confirmed full recovery after cleaning.

Ihsancan Ozpoyraz
Head of Growth

How Kavaken detected soiling on one inverter unit, tracked the growing loss, and confirmed full recovery after cleaning.
Soiling builds up gradually. A dusty unit keeps producing, just a little less every day. This case study shows how Kavaken detected soiling on one inverter unit at a solar plant, quantified how fast the loss was growing, and confirmed that output returned to normal after cleaning.
The Challenge
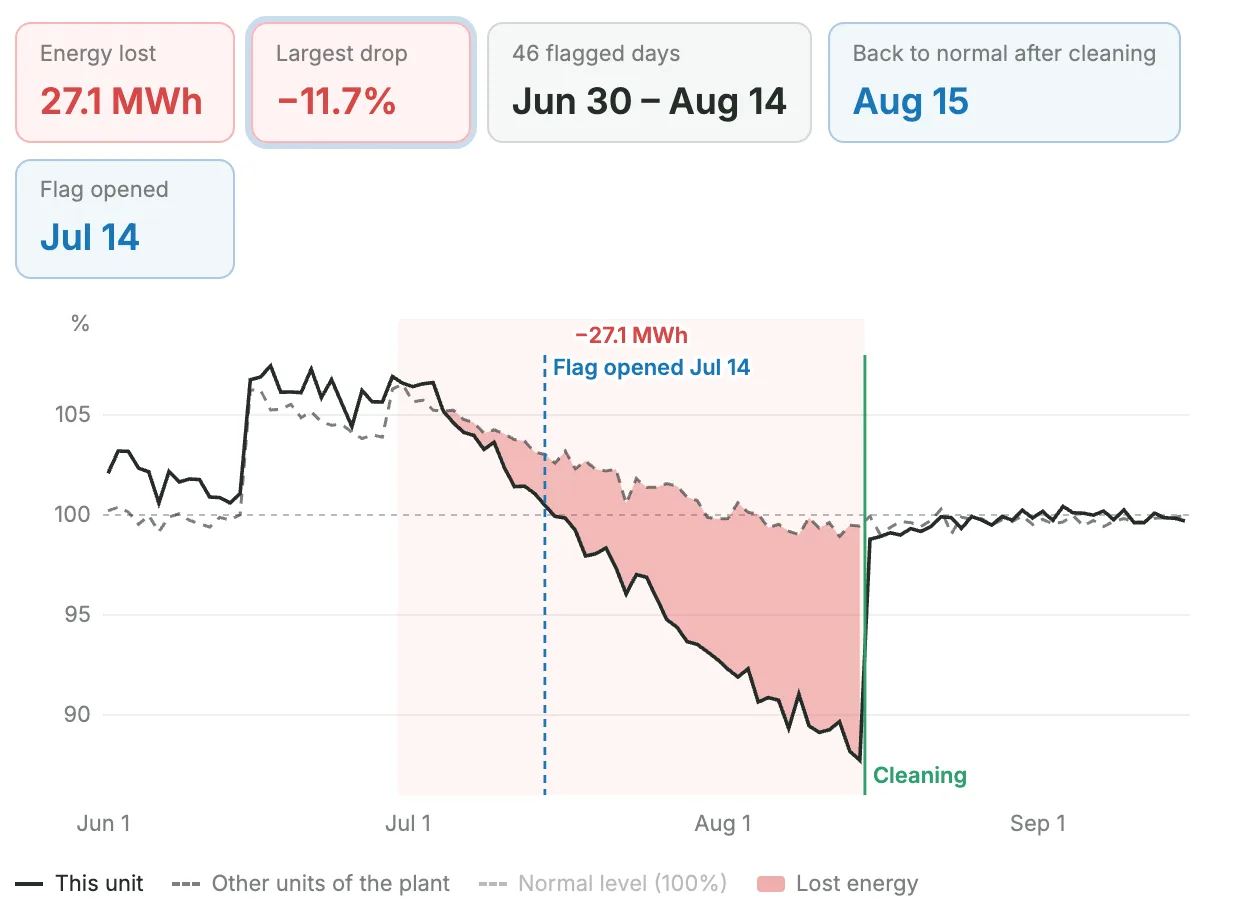
From 30 June 2026, INV1-UNIT1 at a solar plant began producing less than expected for the measured irradiance and module temperature. The gap widened by about 0.27% a day. The other units of the plant, working under the same conditions, showed no such loss. There were no fault codes and the unit kept producing, so nothing in a standard production report pointed to a problem.
How Kavaken Detected It
Kavaken models each unit’s expected output from irradiance and module temperature, then corrects for how the other units of the plant performed under the same sky. This removes weather from the comparison and isolates the unit’s own behaviour.
On 14 July 2026, Kavaken’s anomaly detection opened a flag on INV1-UNIT1. The previous day, the unit had produced 2.1% less than expected, and it was slipping further every day.
Three observations pointed to soiling:
- Only INV1-UNIT1 was affected. The other units of the plant showed no such loss.
- The loss was present at every hour of the day. That ruled out shading, clipping and grid limitation.
- The loss was slightly larger when the sun was low. This is the pattern dirt on the glass produces.
Kavaken listed three possible root causes:
- Dust or dirt deposited on the modules during a dry period
- Dust from nearby construction, roads or farming
- Bird droppings or pollen on part of the array
The recommended actions were to clean the modules of the affected block, and to plan future cleanings from the measured soiling rate rather than a fixed calendar.

Timeline of Events
- 14 July 2026: Kavaken opened the flag and asked the site team to check the modules of the INV1 block.
- 14 July 2026: The site team reported no rain for three weeks and dust from road works north of the plant. The INV1 block is the closest to the road, and its modules looked dusty.
- 28 July 2026: Kavaken reported that the loss had reached 7.1% and was growing by about 0.27% a day, with 8.5 MWh lost so far. Kavaken raised the risk to high and recommended bringing the cleaning forward.
- 5 August 2026: The site team booked cleaning of the INV1 block for 15 August, the cleaning contractor’s first available slot.
- 15 August 2026: The modules were cleaned. Output returned to its normal level the same day.
- 17 August 2026: Kavaken reported INV1-UNIT1 back at 99.1% of its normal level, in line with the other units, and kept the flag under observation.
- 22 August 2026: Output had stayed at its normal level for a week after the cleaning. Kavaken confirmed full recovery and closed the flag.
What the Data Shows
The flagged period ran from 30 June to 14 August 2026: 46 days and 27.1 MWh of lost energy. At its largest, on 14 August, the gap reached 11.7%. After cleaning, output returned to its normal level and stayed there.
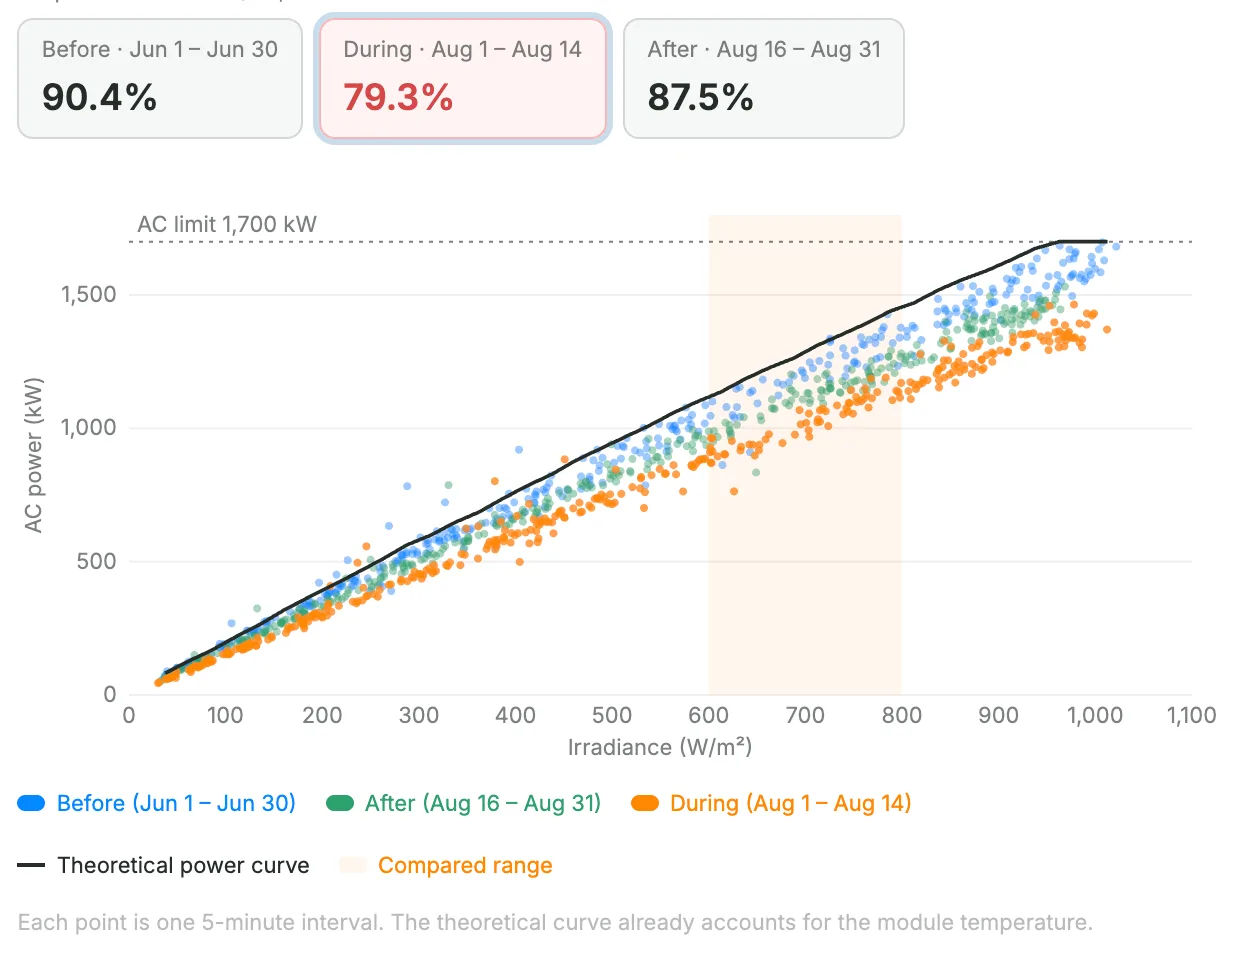
The power curve shows the same effect. Between 1 and 14 August, INV1-UNIT1’s output sat well below its June level across the irradiance range. After cleaning, it moved back up.
Why It Matters
Soiling loss grows every day the modules stay dirty. In this case the gap widened by about 0.27% a day, driven by a dry spell and a new dust source next to one block. A fixed cleaning calendar cannot respond to either. Measuring the soiling rate per unit shows which block needs cleaning and when.
Kavaken’s role was to make that loss visible and actionable:
- Detect a soiling loss on a single unit, separated from weather
- Narrow the cause to soiling from the pattern of the loss
- Quantify the daily rate and the energy lost, so the cleaning could be prioritised
- Verify the recovery after cleaning
Conclusion
Kavaken detected soiling on one inverter unit, quantified how fast the loss was growing, and gave the site team the evidence to schedule the cleaning. After the modules were cleaned on 15 August, output returned to its normal level the same day and stayed there.


