A Slowly Widening Gap: Finding a Degrading String at a Solar Plant
How Kavaken traced a 1.8% underperformance on one inverter unit to hot cells on a single string.

Ihsancan Ozpoyraz
Head of Growth

How Kavaken traced a 1.8% underperformance on one inverter unit to hot cells on a single string.
A unit that loses 0.2% of its output a month never trips an alarm. Over eight months, it adds up. This case study shows how Kavaken detected a slow DC-side loss on one inverter unit at a solar plant, narrowed it down to a single string, and quantified what it was costing.
The Challenge
From mid-February 2026, INV2-UNIT1 at a solar plant began producing less than the other units on site. The drop was small and gradual. There were no fault codes and no outage. Seasonal changes in irradiance and temperature move every unit’s output far more than this, so the loss sat inside normal variation and would not stand out in a daily production report.
How Kavaken Detected It
Kavaken models each unit’s expected output from irradiance and module temperature, then corrects for how the other units of the plant performed under the same sky. This removes weather from the comparison and isolates the unit’s own behaviour.
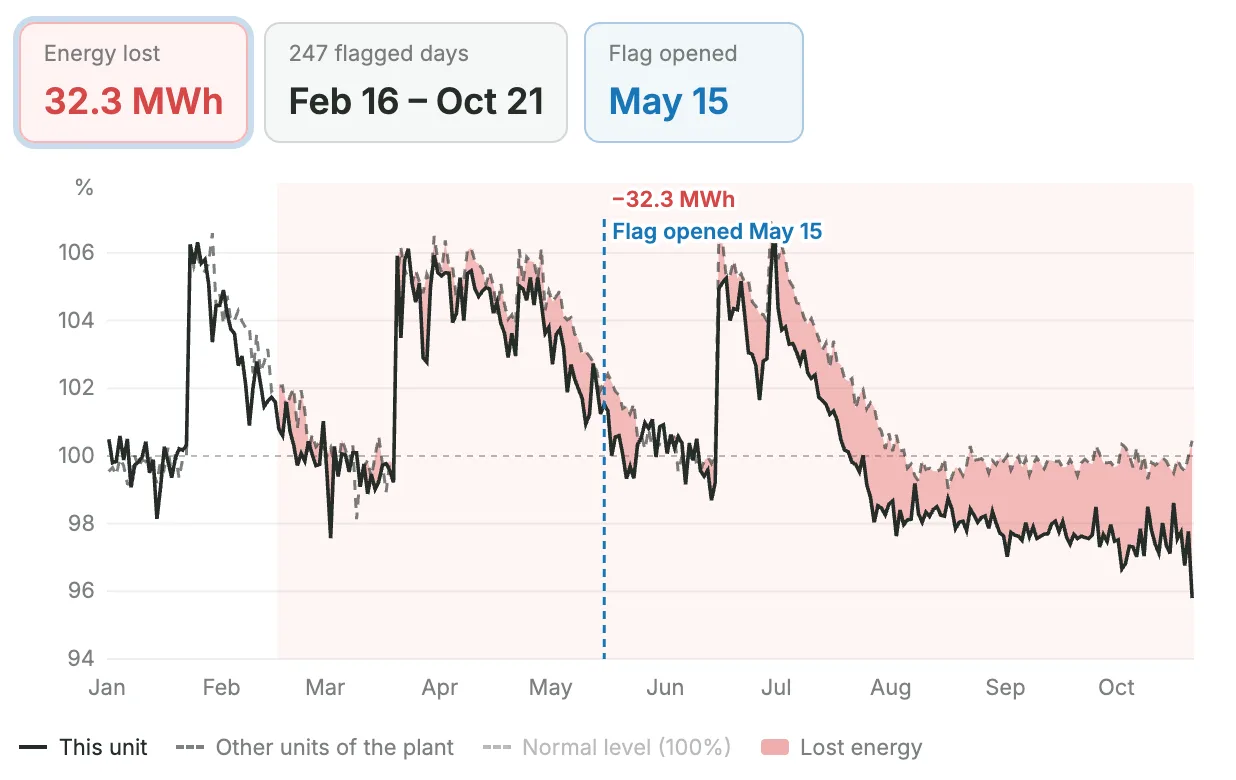
On 15 May 2026, Kavaken’s anomaly detection opened a flag on INV2-UNIT1. Over the previous 30 days, the unit had produced 1.0% less than expected, and the gap was growing every week.
Two observations pointed to the cause:
- The loss was present at every hour of the day. Shading depends on sun position and clipping only occurs near peak output, so neither could explain it.
- It matched a string current flag already open on the same unit. Two independent signals were pointing at the same place.
Together, these placed the problem on the DC side. Kavaken listed three possible root causes:
- Degrading modules (hot spots, cell cracks, potential-induced degradation)
- A string with a high-resistance connection or a damaged cable
- Failed bypass diodes
The recommended action was thermography and IV-curve measurements on the unit’s strings.
Timeline of Events
- 15 May 2026: Kavaken opened the flag. INV2-UNIT1 was 1.0% below expected over the last 30 days, with the loss present at every hour and consistent with the open string current flag.
- 24 June 2026: The site team moved the flag to investigation and added it to the thermography and IV-curve check already planned for the unit’s strings.
- 3 July 2026: Thermography found several hot cells on one string of INV2-UNIT1. Its IV curve showed a lower fill factor than the neighbouring strings, confirming module degradation on that string.
- 20 August 2026: Kavaken reported that the gap had grown to 1.3% and the unit had lost 21.0 MWh since February. The decline was steady, with no sign of levelling off.
- 15 October 2026: The site team scheduled replacement of the affected modules.
- 22 October 2026: The gap reached 1.8%, with 32.3 MWh lost since February.
What the Data Shows
The flagged period runs from 16 February to 21 October 2026: 247 days and 32.3 MWh of lost energy.
The power curve comparison makes the gap visible. Between 21 September and 20 October, INV2-UNIT1 sat consistently below its sister unit INV2-UNIT2, scaled to the same size, across the irradiance range.

Why It Matters
A degrading string does not stop production. It erodes it. In this case the gap widened by about 0.2% every month, and the energy lost kept accumulating for as long as the string stayed in service.
Kavaken’s role was to make that loss visible and actionable:
- Detect a drift too small to see in raw production data
- Narrow the cause to the DC side before anyone went on site
- Quantify the loss in MWh, so the repair could be prioritised against its cost
- Verify the result by tracking the unit after the fix
Conclusion
Kavaken detected a loss too gradual to show up in production reports, narrowed it to the DC side, and gave the site team the evidence and the numbers to act on. Thermography confirmed the cause on a single string, and the client scheduled the replacement of the affected modules.
Cover image by aldwardcv31 from Unsplash


